Analytics 360 is a tool that gives you reports with your data from ShispGo. This tool provides datasets and graphs that you can predict with the shipments you send tracking requests. This content has been created as a guide for you. It explains each component you see in the “Analytics 360” tab in ShipsGo Dashboard with visuals for you. In this content, the components in the “Analytics 360 – Volume” tab are explained.
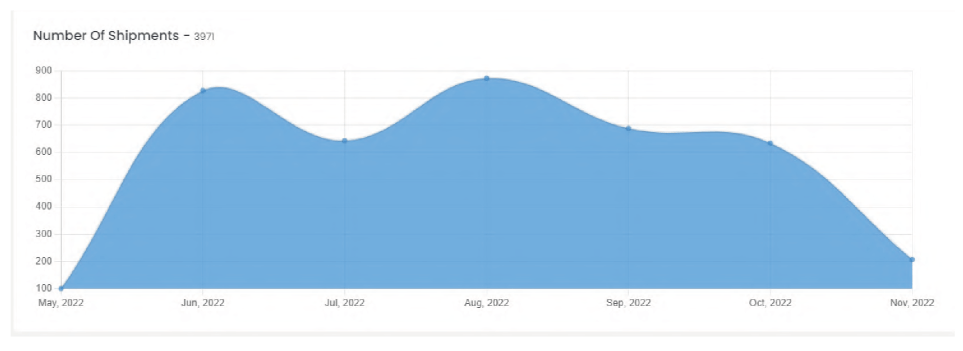
On the Volume page, you will find general analytics of your shipments. In the image below, you’ll find the number of shipments completed during the selected time interval.


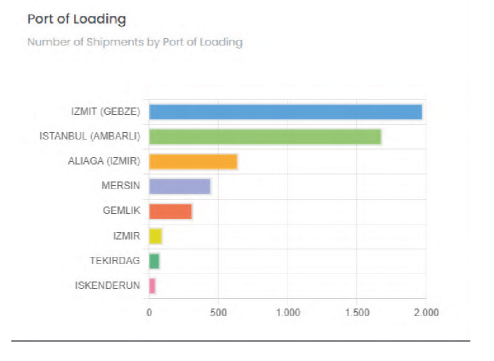
In the second section, you can view the number of shipments
differentiated by Port of Loading and Port of Discharge.

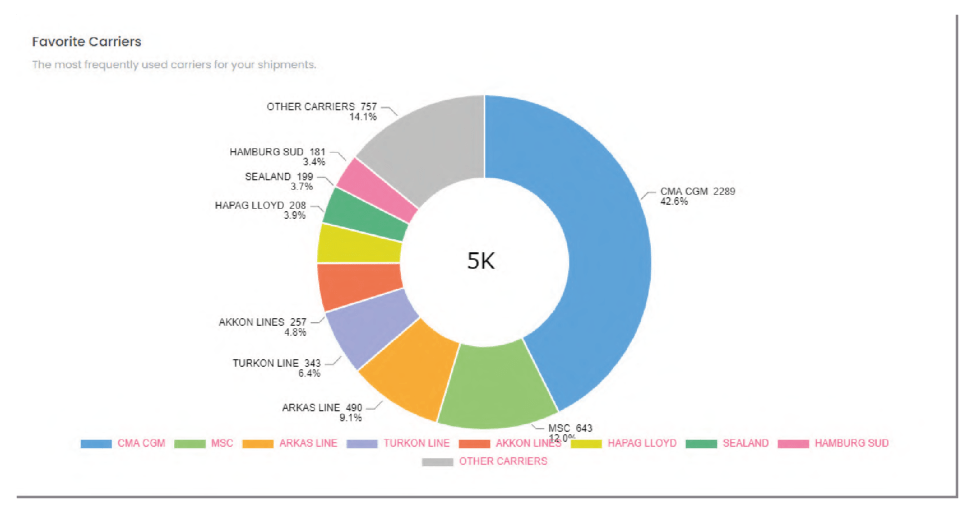
In the image above, you can view the number and percentage of
shipments that were shipped with each carrier.

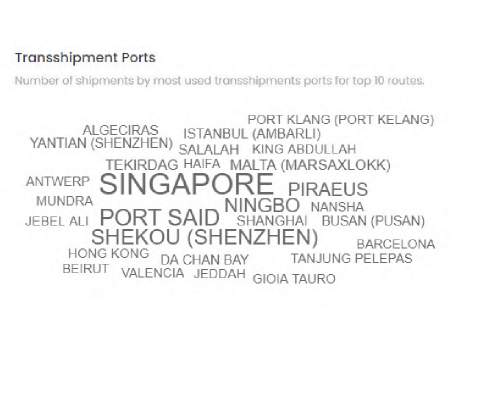
You can view the number of shipments by transshipment ports by hovering over it.