Welcome to ShipsGo Digital World
Analytics 360 - Performance
Analytics 360 is a tool that gives you reports with your data from ShispGo. This tool provides datasets and graphs that you can predict with the shipments you send tracking requests. This content has been created as a guide for you. It explains each component you see in the “Analytics 360” tab in ShipsGo Dashboard with visuals for you. In this content, the components in the “Analytics 360 – Performance” tab are explained.
Shipment Counts and Schedule Reliability
On the Performance page, you will find general performance analytics of your shipments.
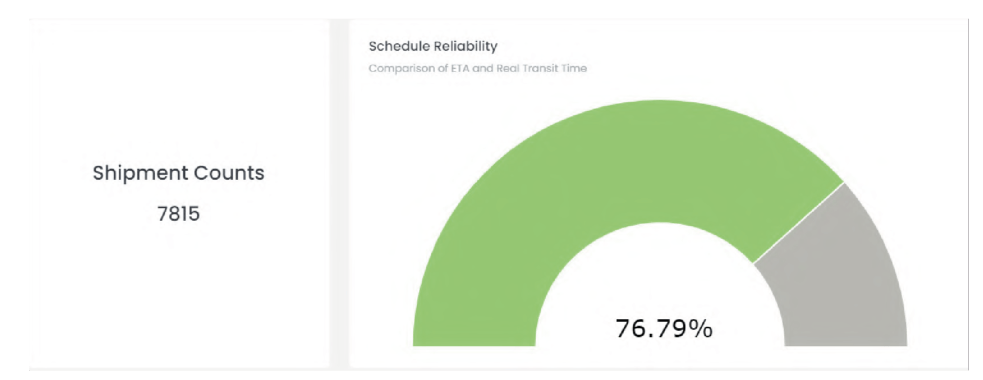
In the first section, you’ll find your Schedule Reliability percentage based on the comparison of the first ETA and Real Transit Time.
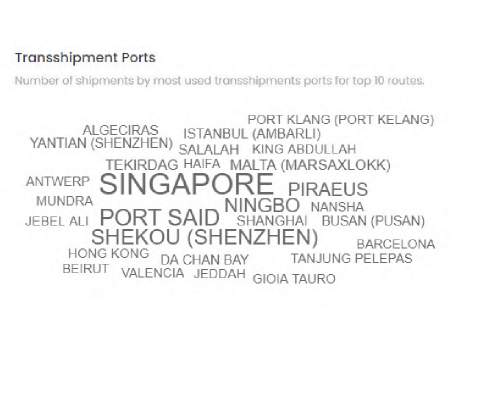
On the left section, if you keep your pointer on one of the Transshipment Port names, you can view the number of shipments with that TS port.
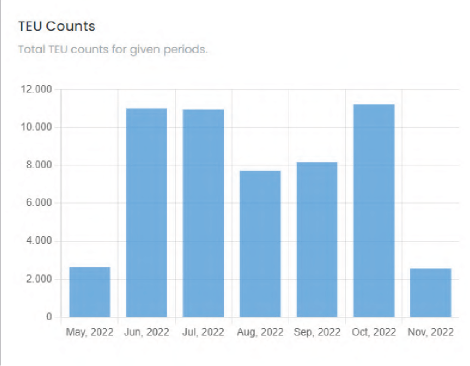
In the right section, if you keep your pointer on one of the columns, you’ll see the count of TEUs on the given time interval.
")


