Welcome to ShipsGo Digital World!

What is Analytics 360?

Analytics 360 is an interactive tool for your container shipments. It creates insights based on the routes, carriers, ports, and seasons. It provides advanced analytical reports using regression models and machine learning. This content is an Analytics 360 Guideline. On the following pages you can find all about Analytics 360 in the ShipsGo Dashboard.

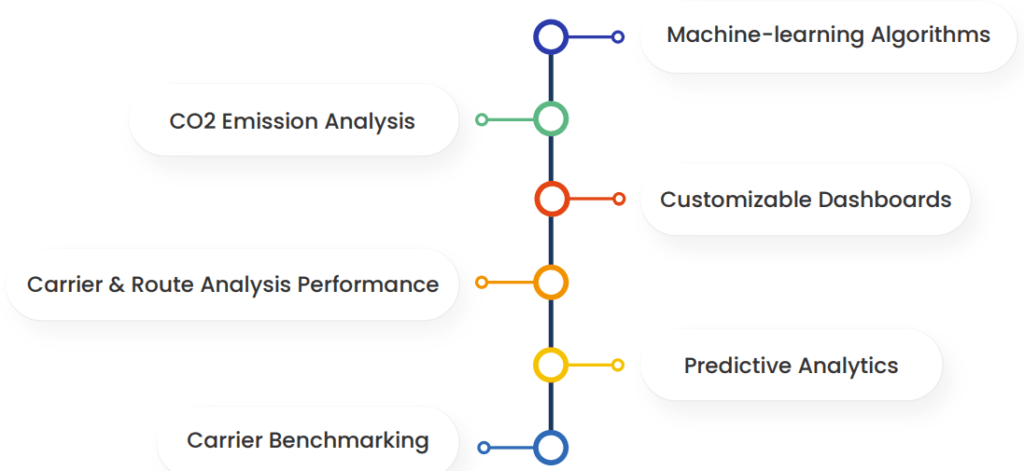
Enhance your company’s decision-making process with Analytics 360
How to use filters and time interval?
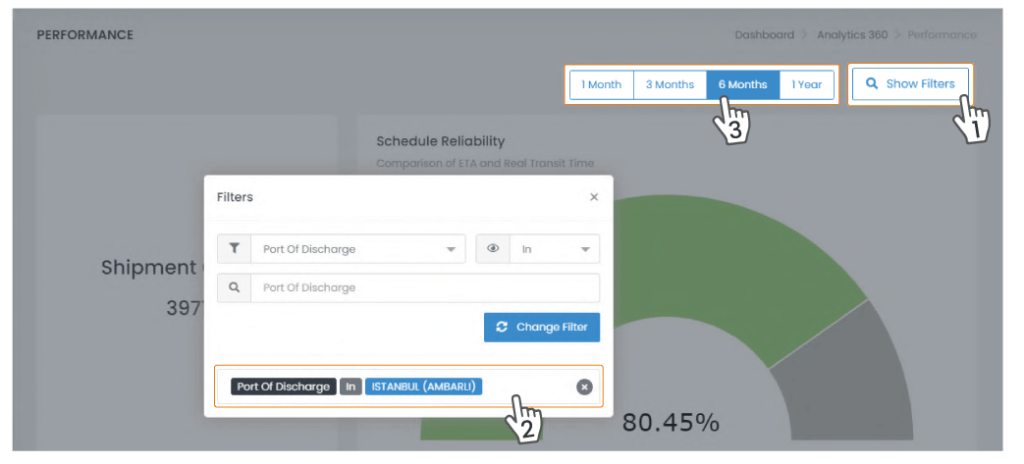
  1. You can filter the data on all of pages, by using the Show Filters button.
  2. There are 4-7 different parameters you can choose for filtering. You can add more than one filter or multiple parameters for each filter at once. Then click on the outer (gray) space of the pop-up window, and the results will be listed automatically.
  3. You can select the time interval and the graphs will be automatically updated.
How to export Analytics 360 graphs?

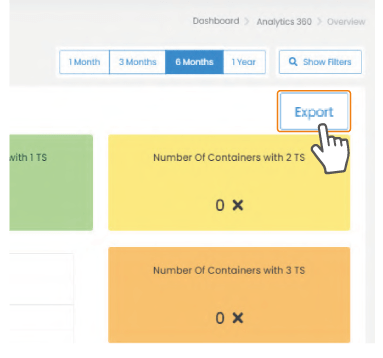
You can extract each page as a PDF file by clicking on Export button that’s on the right upper corner.