Welcome to ShipsGo Digital World
Analytics 360 - Route Performance
Analytics 360 is a tool that gives you reports with your data from ShispGo. This tool provides datasets and graphs that you can predict with the shipments you send tracking requests. This content has been created as a guide for you. It explains each component you see in the “Analytics 360” tab in ShipsGo Dashboard with visuals for you. In this content, the components in the “Analytics 360 – Route Performance” tab are explained.
Port of Loading - Port of Discharge
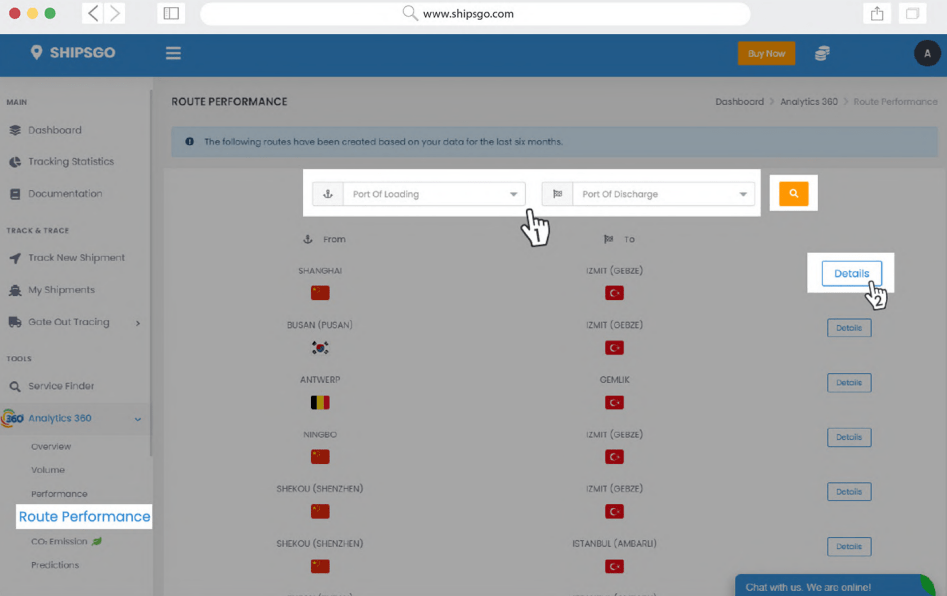
You can enhance your decision-making process by examining carrier-based comparisons on a selected route.
You can choose a route by selecting ports of loading and discharge and clicking on the Search button.
Or you can select from the below list of your mostly used routes, by
clicking on the Details button.
Carriers Average Transit Times
After your selection, you will find route performance analytics of your
shipments on the selected route. In the first section, you’ll find the
average transit times of your shipments on this route, differentiated by carriers. The carriers displayed here are the most-used ones by you.
Carriers Late/Early Arrivals
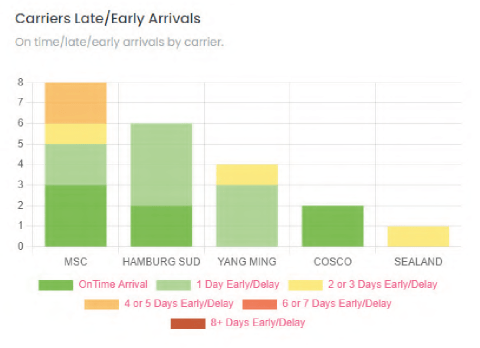
In the second section, you can find the on-time/late/early arrival numbers of your shipments on this route, differentiated by carriers.
TS Waiting Times
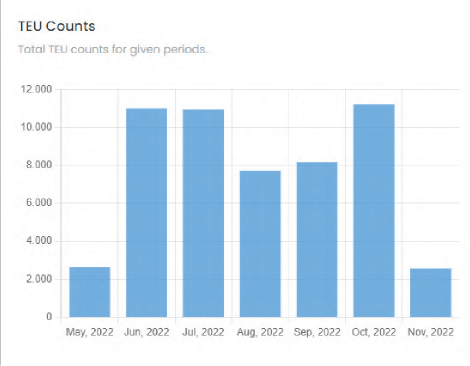
TEU Counts
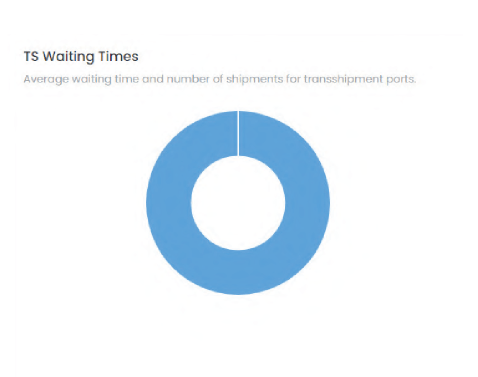
On the left section here, you can see the average waiting times of your shipments on the different Transshipment Ports of this route.
On the right section, if you keep your pointer on one of the columns, you’ll see the count of TEUs shipped on this route in the given time interval.
")


